- What is a Business Intelligence Dashboard?
- What is the core purpose of a business intelligence dashboard?
- Different types of Business Intelligence dashboards
- What features must you include in a Business Intelligence Dashboard?
- Benefits of using Business Intelligence Dashboards
- Process to develop an effective Business Intelligence Dashboard in React
- How to install a pivot table?
- How to install a Charting Library?
- Some add-ones
- Conclusion
What is a Business Intelligence Dashboard?
What is the core purpose of a business intelligence dashboard?
Different types of Business Intelligence dashboards

- Analytical Dashboard
- Operational Dashboard
Analytical Dashboard
Analytical Dashboard is nothing but a dashboard that is designed to do in-depth analysis on a large number of data. The analysis allows the users to see the trends, predict the outcomes and monitor major insights.To understand it more clearly, the most common advantage of an Analytical Dashboard is MRR/Accounts. Moreover, it is a common reporting tool which is designed by data analysts to perform accurate analysis. The data from the dashboard is collected on a very regular basis and it's always on the mark.It is important for the businesses to know that the Analytical Dashboard offers advanced BI features like ad-hoc querying.Operational Dashboard
The Operational Dashboard is skillfully designed so that it could continuously monitor the changing business processes. It also keeps a watchful eye on the KPIs and the performances of the key metrics.The sole purpose of the Operational Dashboard is to monitor and record data updates. As this record is taken on a frequent basis, the data should be authentic and correct. The information in the Operational Dashboard is viewed by the high-end professionals. Thus, the data update should be on time as they will review it several times a day.The ‘Daily Web Overview’ is one of the most commonly seen examples of the Operational Dashboard. The purpose of the Web Overview is to track hourly performance of the web. The performance tracking takes place on the pre-defined objective of a digital marketing team.What features must you include in a Business Intelligence Dashboard?
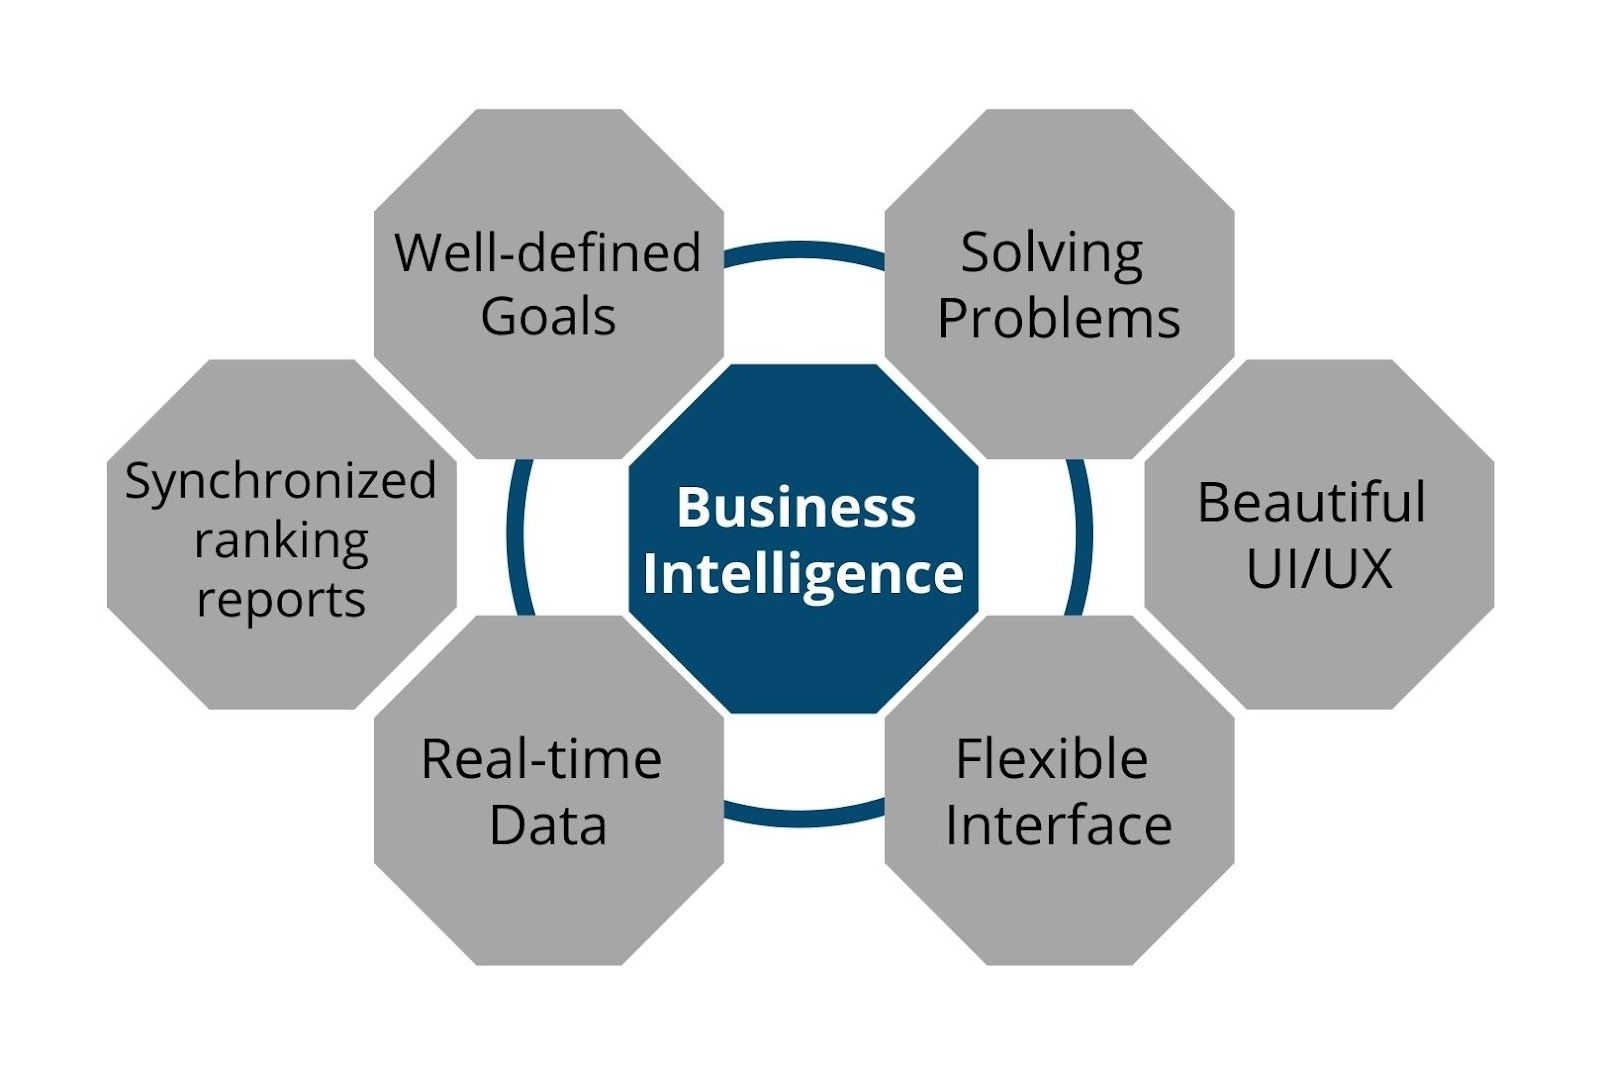
Solving problems
The BI dashboard developer team must always focus on developing a BI dashboard that generates problem solving reports. Moreover, this approach is only possible if the dashboard is flexible and can adjust to the customized requirements.Beautiful UI/UX
The BI dashboard should be attractive and simple at the same time. Moreover, it should be detailed and straightforward so that the user doesn’t have any problem accessing it. The BI dashboard developer should always look to avoid the clutter and help in improving the analytics process.Flexible Interface
It is an unwritten rule that the interface of a business intelligence dashboard should be flexible to cater any required need. Because, if the interface is not customized, data collection will be a problem. Thus, the interface should be able to mould itself as per the needs.Real-time data
Availability of real-time data is absolutely crucial as the BI dashboard should be updated frequently. This means that it has to pull real-time data anytime and according to the requirement as well.Synchronized ranking reports
The businesses will never understand their performance if the reports are not in order. Thus, the BI dashboard must be able to generate orderly ranking reports. This will allow the company to understand its best areas and the areas of concern.Moreover, the ranking system will also enable the business personnel to see the performance across multiple dimensions. It will also allow them to focus on a key aspect and work on bettering the result the next time.Well-defined goals
A BI dashboard developer should develop a dashboard that can work on all the key metrics. This will help the company to define their target audience and mould everything according to their needs. Moreover, since the goals are defined, making changes in the business strategy will become easy.
Benefits of using Business Intelligence Dashboards
In a nutshell, a BI dashboard is an easy to read summary of all the important business information. Thus, now it is time to take a look at this path-breaking information tool.- The business intelligence dashboard is always programmed so that it can suit any mobile device. Thus, the company can expand their business and reach anywhere with concrete analysis
- With the BI dashboard, you will have everything available (data analysis) with the minutest of details. The detailed information provided by the dashboard helps companies to understand the trends and act accordingly.
- The business intelligence dashboards are highly customized. The level of customization is so immaculate that each decision level dashboard can be changed according to the requirement.
- The information tool is an all-in-one kind of destination. The business professionals can just glance on the tool and get all the desired information quickly.
- BI dashboards have marvelous attention to detail. Moreover, the graphical views communicate the information in a hassle-free manner. It helps in speeding up the overall business communication process.
- You do not need technical IT skills to implement modern-service BI. With the self-service BI, the dashboard will render company wide access to important, necessary and invaluable data.
Process to develop an effective Business Intelligence Dashboard in React

- Grouping of the data under separate dimensions
- Aggregating the numbers
- Sorting the numbers in ascending or descending order as per the requirement
- High-end interactivity with the other elements
Process
The building process of the dashboard has two different parts:- Analytical
- Visual
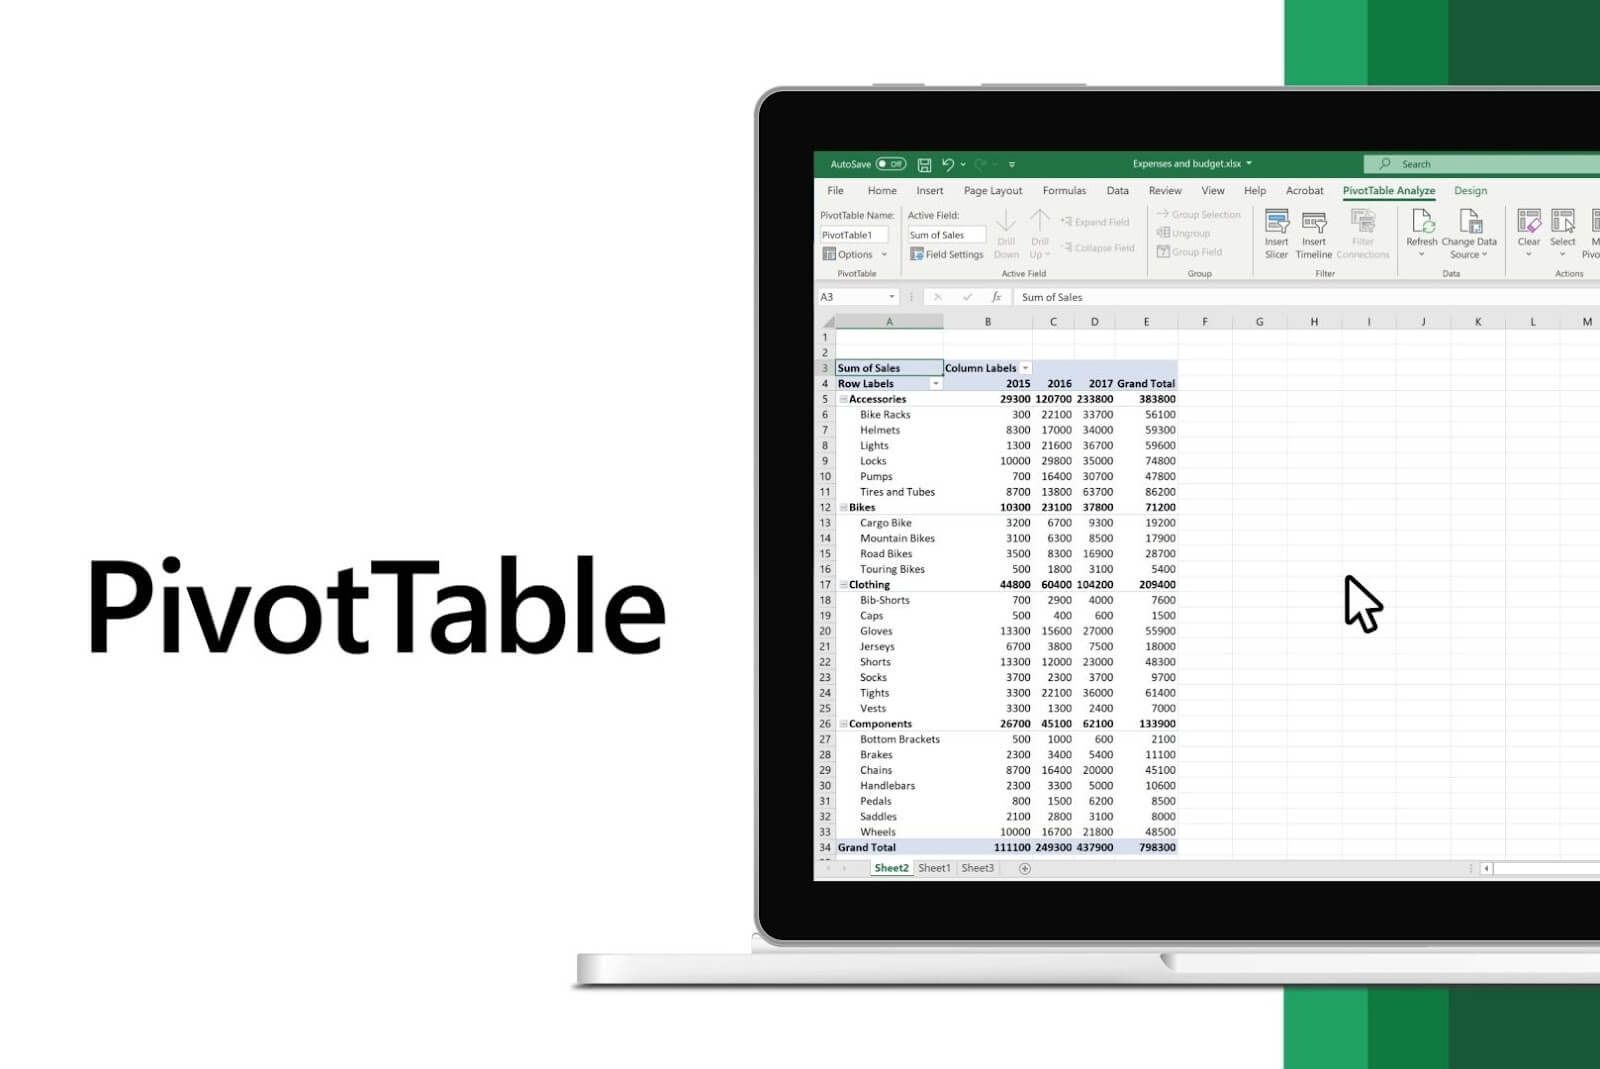
How to install a pivot table?