
‘Data is the new fuel’ that powers and runs most of the modern-day businesses around the world. We all are aware of the fact that information in any kind is necessary to run a fruitful business. And more so because of the dynamic needs of the modern business world.
Table of Content
- What is a Business Intelligence Dashboard?
- What is the core purpose of a business intelligence dashboard?
- Different types of Business Intelligence dashboards
- What features must you include in a Business Intelligence Dashboard?
- Benefits of using Business Intelligence Dashboards
- Process to develop an effective Business Intelligence Dashboard in React
- How to install a pivot table?
- How to install a Charting Library?
- Some add-ones
- Conclusion
Information management is very essential and thus all the companies need a business intelligence dashboard.
What is a Business Intelligence Dashboard?
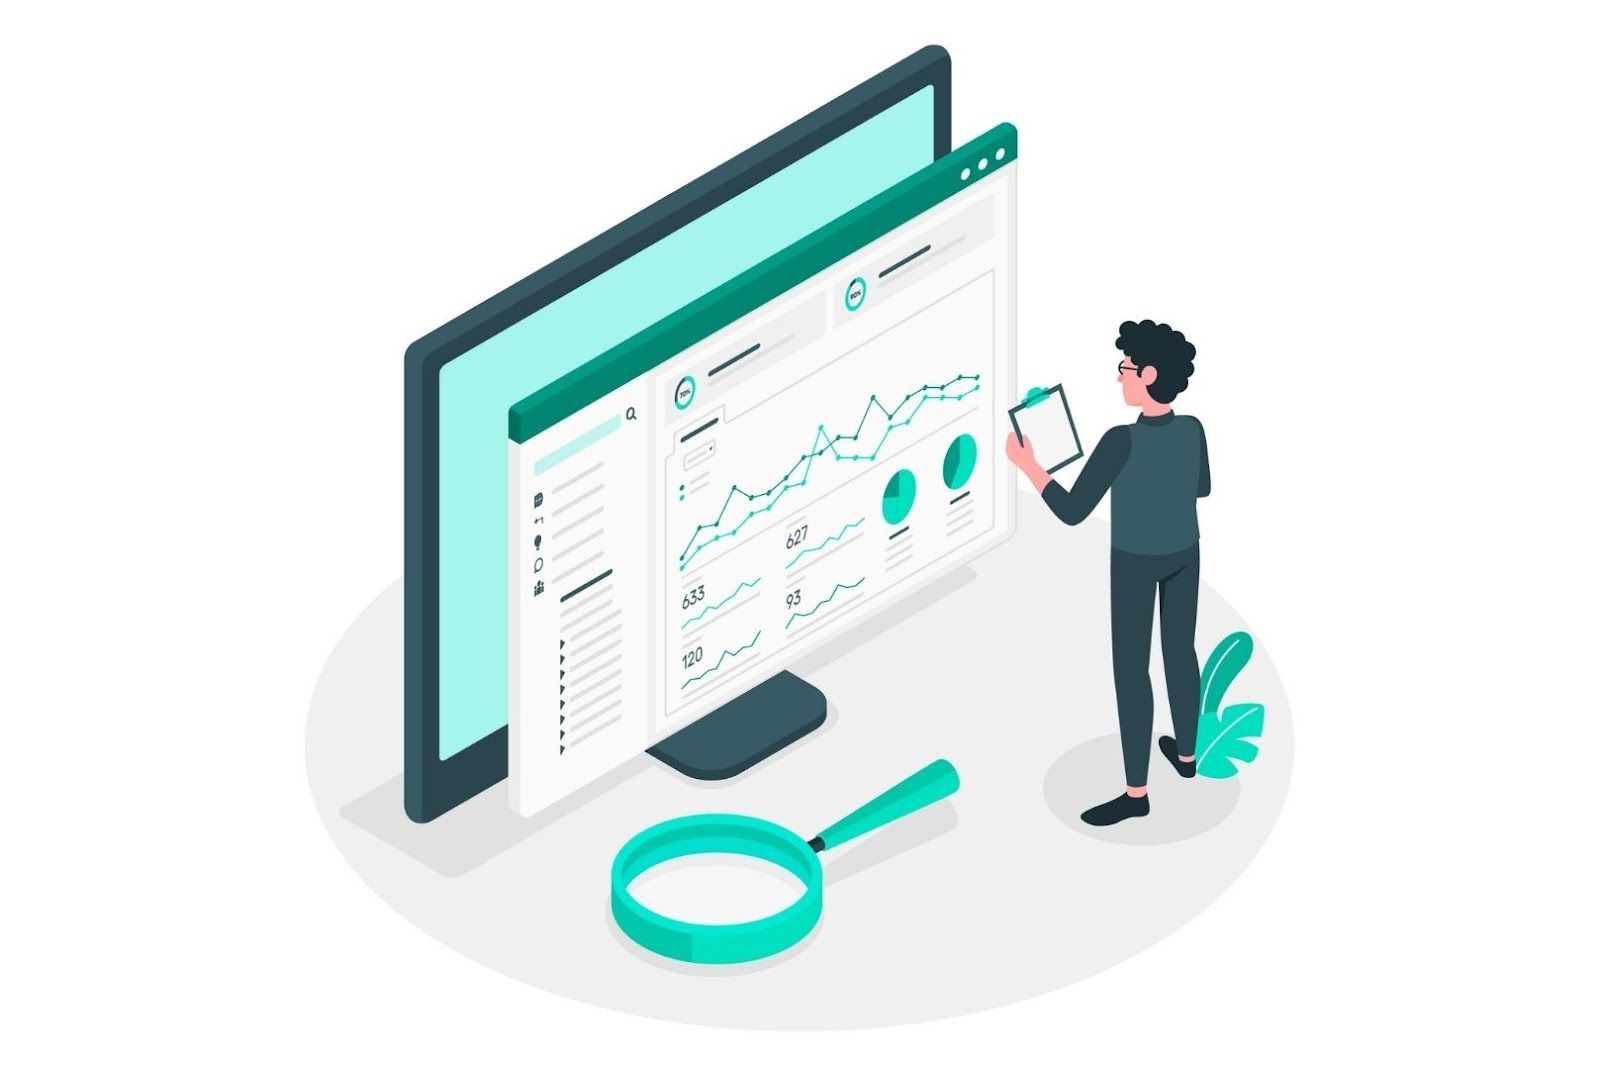
In simple words, a business intelligence dashboard is an information management tool. This tool utilizes data visualization technology in order to analyse the data in a concrete manner. Along with analysing, it displays the available information in a useful and a very practical way.
The business intelligence dashboard has multiple utilities within the organization. It can be used for multiple functional areas for the organization’s internal work. In addition, this tool aids in measuring the performance and also manages the inventory. Irrespective of the size of your organization, the business intelligence dashboard helps a great deal.
In this blog, we will understand the nuances, business benefits and how to build a business intelligence dashboard in React. Since the React framework is on the rise since its inception, building BI in react will prove to be beneficial for the businesses.
So, here we begin!
What is the core purpose of a business intelligence dashboard?
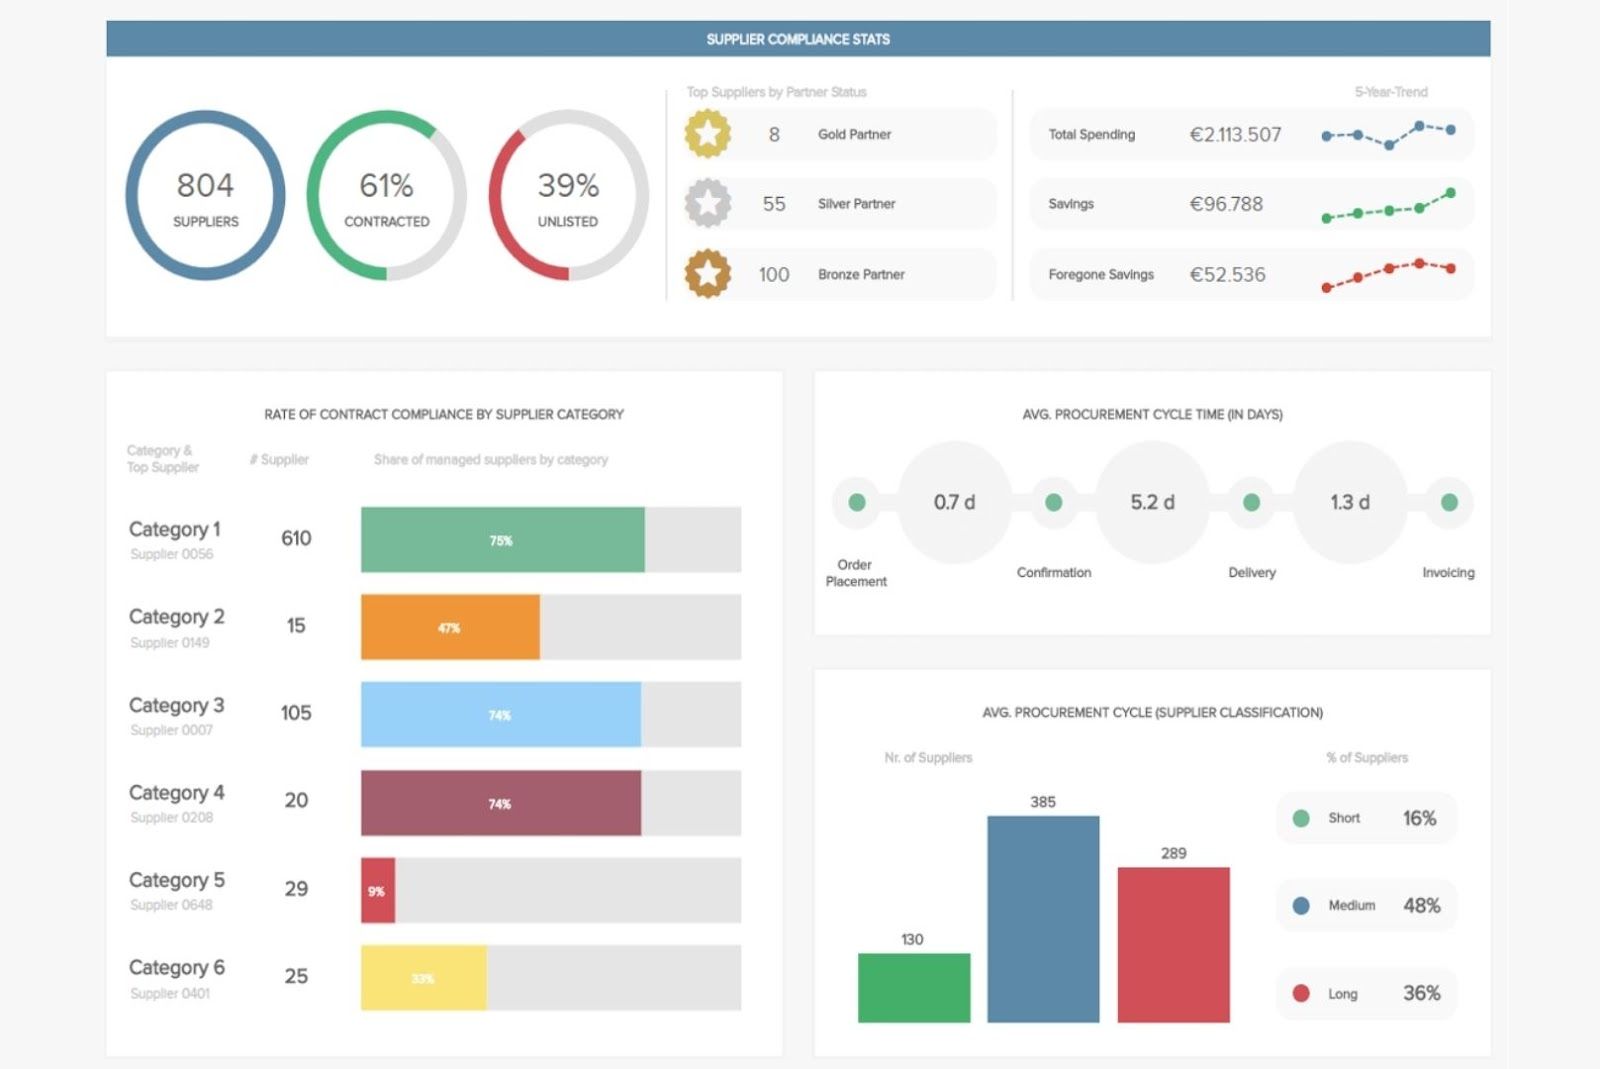
The main purpose of a BI dashboard is to display the Key Performance Indicators (KPIs). It does that by tracking the data points that are very important for your business. The perks of having a BI tool is that it adjusts quickly to the business needs as it doesn’t have a fixed nature. It has an intuitive design that consolidates the graphs and charts on a single screen. This will help the reader to see all the vital information in a bigger picture.
The business intelligence dashboard consolidates the data from the entire business organization and puts it on to the custom dashboard. This will help the business personnel to see valuable insights and understand the performance in a clear way. Moreover, the dashboard focuses on generating actionable insights as well. It will help the organization to improve its performance and stay relevant in the market.
The characteristic of a good BI dashboard is that it monitors the business performance metrics clearly. It also provides centralized access to the users in real time. This allows them to evaluate important information and interact with it closely. This synchronized work enables the business organization to take more data-driven decisions.
Visualization helps the brain to understand things in a faster manner. Thus, one should build a business intelligence dashboard in React as it has useful cutting-edge solutions.
Now a question would arise in your mind, what are different type of BI dashboards. Well, we have got you covered on that front as well.
Different types of Business Intelligence dashboards

There are business organizations across the globe that work on data on a large scale. Because of this, there is always a hassle and things could get startled mid-way. Thus, it becomes imported for the companies to logically sort their data and keep it accessible and maintainable.
For this, the business intelligence dashboard has two different types according to the needs of the clients. They are:
- Analytical Dashboard
- Operational Dashboard
Analytical Dashboard
Analytical Dashboard is nothing but a dashboard that is designed to do in-depth analysis on a large number of data. The analysis allows the users to see the trends, predict the outcomes and monitor major insights.
To understand it more clearly, the most common advantage of an Analytical Dashboard is MRR/Accounts. Moreover, it is a common reporting tool which is designed by data analysts to perform accurate analysis. The data from the dashboard is collected on a very regular basis and it's always on the mark.
It is important for the businesses to know that the Analytical Dashboard offers advanced BI features like ad-hoc querying.
Operational Dashboard
The Operational Dashboard is skillfully designed so that it could continuously monitor the changing business processes. It also keeps a watchful eye on the KPIs and the performances of the key metrics.
The sole purpose of the Operational Dashboard is to monitor and record data updates. As this record is taken on a frequent basis, the data should be authentic and correct. The information in the Operational Dashboard is viewed by the high-end professionals. Thus, the data update should be on time as they will review it several times a day.
The ‘Daily Web Overview’ is one of the most commonly seen examples of the Operational Dashboard. The purpose of the Web Overview is to track hourly performance of the web. The performance tracking takes place on the pre-defined objective of a digital marketing team.
What features must you include in a Business Intelligence Dashboard?
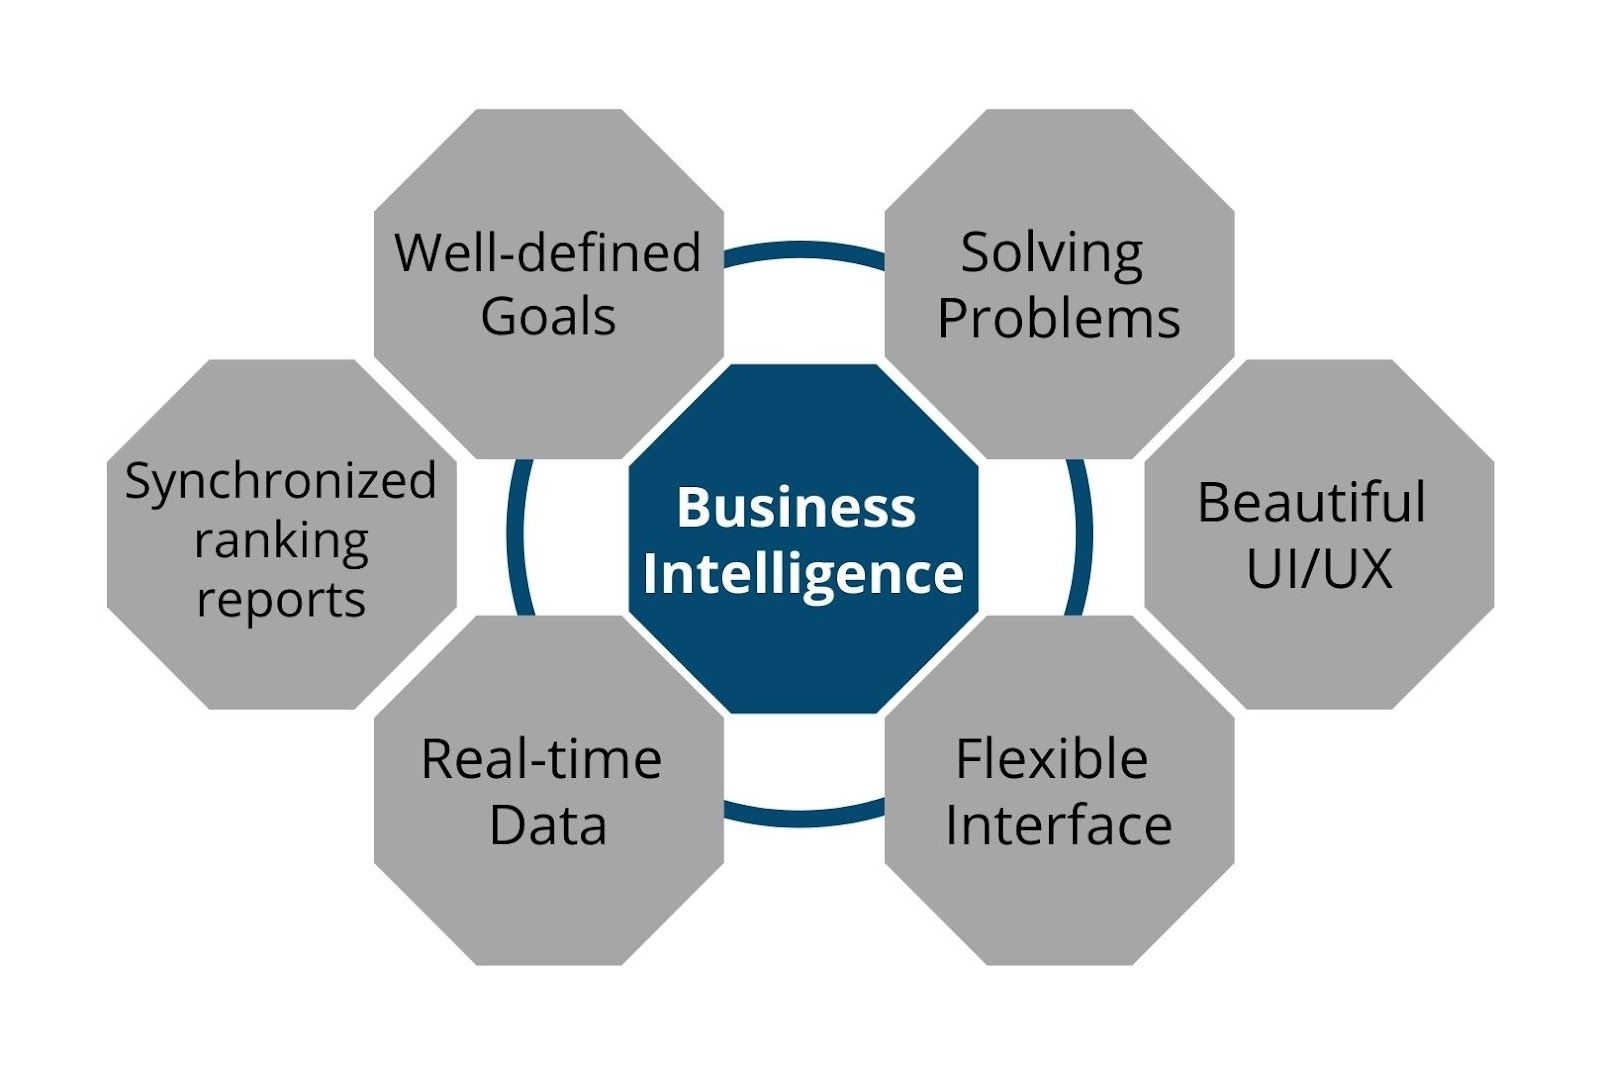
Having emphatic features is the need of the hour in order to make software products work in today’s tech-driven world. And the story of the business intelligence dashboard is no different. Thus, for your benefit, we have curated a list of all the important BI dashboard features.
Solving problems
The BI dashboard developer team must always focus on developing a BI dashboard that generates problem solving reports. Moreover, this approach is only possible if the dashboard is flexible and can adjust to the customized requirements.
Beautiful UI/UX
The BI dashboard should be attractive and simple at the same time. Moreover, it should be detailed and straightforward so that the user doesn’t have any problem accessing it. The BI dashboard developer should always look to avoid the clutter and help in improving the analytics process.
Flexible Interface
It is an unwritten rule that the interface of a business intelligence dashboard should be flexible to cater any required need. Because, if the interface is not customized, data collection will be a problem. Thus, the interface should be able to mould itself as per the needs.
Real-time data
Availability of real-time data is absolutely crucial as the BI dashboard should be updated frequently. This means that it has to pull real-time data anytime and according to the requirement as well.
Synchronized ranking reports
The businesses will never understand their performance if the reports are not in order. Thus, the BI dashboard must be able to generate orderly ranking reports. This will allow the company to understand its best areas and the areas of concern.
Moreover, the ranking system will also enable the business personnel to see the performance across multiple dimensions. It will also allow them to focus on a key aspect and work on bettering the result the next time.
Well-defined goals
A BI dashboard developer should develop a dashboard that can work on all the key metrics. This will help the company to define their target audience and mould everything according to their needs. Moreover, since the goals are defined, making changes in the business strategy will become easy.

Benefits of using Business Intelligence Dashboards
In a nutshell, a BI dashboard is an easy to read summary of all the important business information. Thus, now it is time to take a look at this path-breaking information tool.
- The business intelligence dashboard is always programmed so that it can suit any mobile device. Thus, the company can expand their business and reach anywhere with concrete analysis
- With the BI dashboard, you will have everything available (data analysis) with the minutest of details. The detailed information provided by the dashboard helps companies to understand the trends and act accordingly.
- The business intelligence dashboards are highly customized. The level of customization is so immaculate that each decision level dashboard can be changed according to the requirement.
- The information tool is an all-in-one kind of destination. The business professionals can just glance on the tool and get all the desired information quickly.
- BI dashboards have marvelous attention to detail. Moreover, the graphical views communicate the information in a hassle-free manner. It helps in speeding up the overall business communication process.
- You do not need technical IT skills to implement modern-service BI. With the self-service BI, the dashboard will render company wide access to important, necessary and invaluable data.
Process to develop an effective Business Intelligence Dashboard in React

One needs the right data visualization tool if one is preparing to develop a business intelligence dashboard in React. One of the main reasons for finding a data visualization tool is that it improves the performance overall. In addition, the dashboard also provides essential features such as:
- Grouping of the data under separate dimensions
- Aggregating the numbers
- Sorting the numbers in ascending or descending order as per the requirement
- High-end interactivity with the other elements
We all know that React is a JavaScript based library. Thus, it allows the BI dashboard development team to create interactive and modular user interfaces. In addition, building BI in React allows the developers the access to common visualization data libraries. It includes high charts or d3 as well.
Process
The building process of the dashboard has two different parts:
- Analytical
- Visual
To understand it deeply, the first part is a pivot table. It is in general responsible for the filtration process of the raw data. On the other hand, the second part is a charting library. It is used to display the data clearly from the charts. These components are an inevitable part if you wish to build an effective business intelligence dashboard in react.
How to install a pivot table?
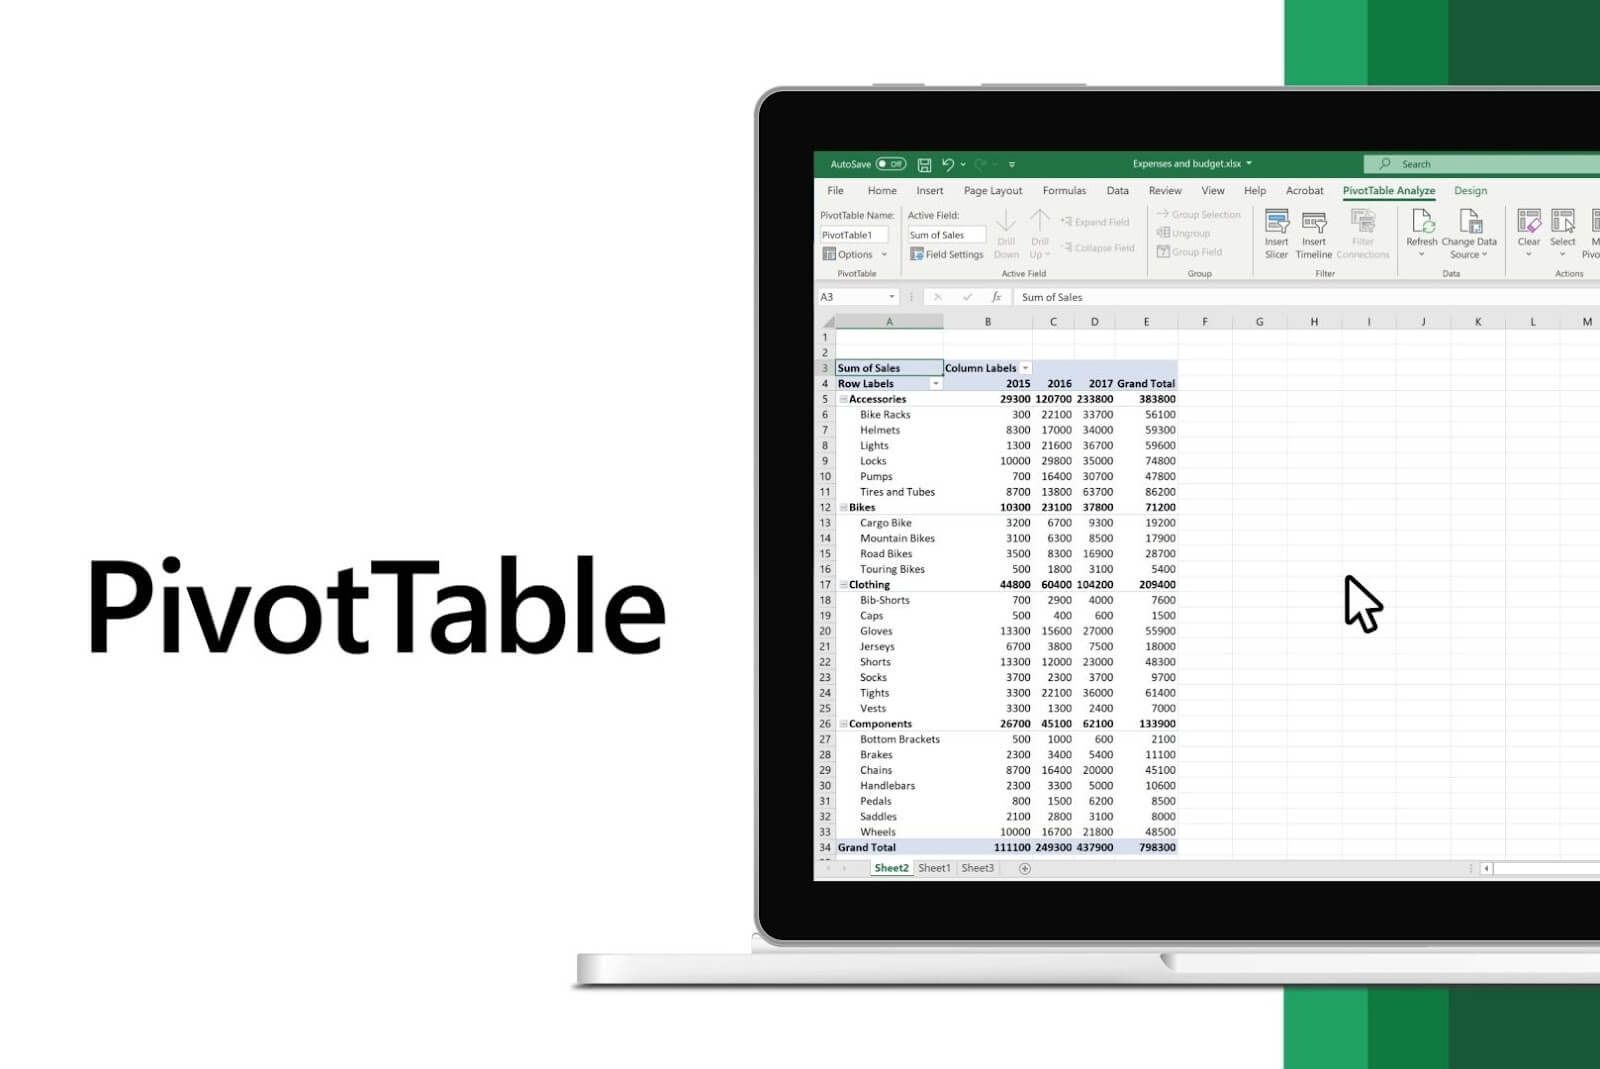
The process of installing a pivot table takes place after developing a single page react application. The BI dashboard developers will install a Flexmonster in the form of an npm package. After this, they render the pivot table into an HTML container.
After this, it is time to load the data using the connector for MongoDB into the component. Once the data is loaded make sure that you define the grid. It will help you to understand which part of the data you need to show on the grid. Moreover, the BI dashboard development team here can try to put hierarchies into the different rows and columns. It will help in better data management.
This completes the process of installing the pivot table. Now the table is ready with the data. Thus, the business intelligence dashboard in React provides effective solutions.
How to install a Charting Library?
Installing a Charting library becomes a cakewalk when you opt to build a business intelligence dashboard in React. For the successful embedding of the library, the developers just need to follow the integration guide with React.
In order to display the data, the developers need to pre-process the data. It is required because the charting library accepts the JSON data in different formats. Thus a pre-process from the pivot table will become an easier way. Moreover, the BI dashboard developers can also look to add connector to the Flexmonster. It will help handling the data process in an apt manner.
Some add-ones
Along with pivot table and charting library, do not forget to add elements to personalize the appearance of the dashboard. You can do this either by applying themes or changing the colours of some particular elements.
Conclusion
Similar to many of its qualities, React adds stars when a business intelligence dashboard is made in it. Moreover, since we all understand the importance of data is immense in the modern world, it should be handled carefully. A business intelligence dashboard in React will provide the best possible analysis to companies. Accurate analysis will also keep them a curve ahead of their peers.
Moreover, not should be taken about the display of the dashboard as well. The BI dashboard development team should focus on creating visually appealing and simple yet attractive user interfaces.
Looking For Expert Guidance on Your Dream Project?
Our diverse team of industry leading veterans can help you build the most viable solution.
Schedule a free consultation callKrunal Shah
Krunal Shah is the CTO and Co-founder at Third Rock Techkno. With extensive experience gained over a decade, Krunal helps his clients build software solutions that stand out in the industry and are lighter on the pocket.